Contents
Idling Devices with Surprising Power Draws
Electric Vehicles in Perspective
Commercial Dishwashers: Washing Away Energy Efficiency
A plug load refers to the energy used by a piece of equipment plugged into a wall outlet. Plug load devices vary by household or business type, but could include Amazon’s Echo, waterbed heaters, smoke detectors, or electric ovens. They may seem small in terms of energy consumption, especially when compared to heating and cooling systems and other major end uses. However, recent studies demonstrate that in California, plug loads collectively account for two-thirds of all residential energy consumption. On the commercial side, they consume slightly less, accounting for one-third of all energy consumption across the entire US commercial sector.
In California, plug loads collectively account for two-thirds of all residential energy consumption.
To understand what’s sucking up so much energy, we compiled Plugging the plug load data hole (XLSX), a resource with data on more than 450 common residential and commercial devices and their annual energy consumption (available to members of the E Source Technology Assessment Service). This spreadsheet contains data on more than 450 common residential and commercial devices and their annual energy consumption. Our updated spreadsheet allows us to compare current plug loads to those of previous years and look at industry trends. Many devices, particularly home appliances, are currently more efficient than they were a few years ago. For example, refrigerators and freezers were on average 20% more efficient in 2017 than they were in 2014.
As in the case of refrigerators, recent trends suggest that in the next few years, home appliances that were once the largest plug loads will likely become more efficient. However, an increase in efficiency doesn’t necessarily mean a decrease in overall energy consumption. For example, electric vehicles (EVs) now have longer ranges, bigger batteries, and faster top speeds, and thus consume more energy. In these cases, the power draw and energy consumption have risen, which may offset efficiency gains seen by other plug loads.
As technologies improve, an increase in efficiency isn’t necessarily a decrease in overall consumption.
Tweet this!
On the commercial side, plug loads vary widely depending on the industry. In commercial kitchens, plug loads accounted for 63% of building energy consumption, with refrigeration alone accounting for 41%. In an office building, plug loads are (surprisingly) the minority of the building’s energy use, ranging from one-quarter to one-half of energy usage in office buildings.
It seems likely that in commercial kitchens, as refrigeration becomes more efficient, plug load usage will also drop. However, in the case of offices and other computing-intensive buildings, as the demand for large computing abilities increases, plug loads will increase.
Idling Devices with Surprising Power Draws
Our Plugging the plug load data hole spreadsheet (XLSX) compiles data about the breakdown of power draw by mode where available. We define these modes as active when the device is being used as intended, idle when it’s turned on but in a low-power mode (for example, a PC in sleep mode), and off when the device is turned off but still plugged into the wall. We found a wide range of power draw among devices in both active and idle modes. However, devices in off mode were more consistent, with power draws varying from a fraction of a watt (W) to a few watts.
Idle-mode power draws ranged from just 0.1 W in devices such as a modem, to 162 W in a 2005 Microsoft Xbox. Other devices with large idle loads include hot tubs (also called portable electric spas), a 2007 Microsoft Xbox, and a 2007 Sony PlayStation. All of these devices draw more than 100 watts, even when not in active use.
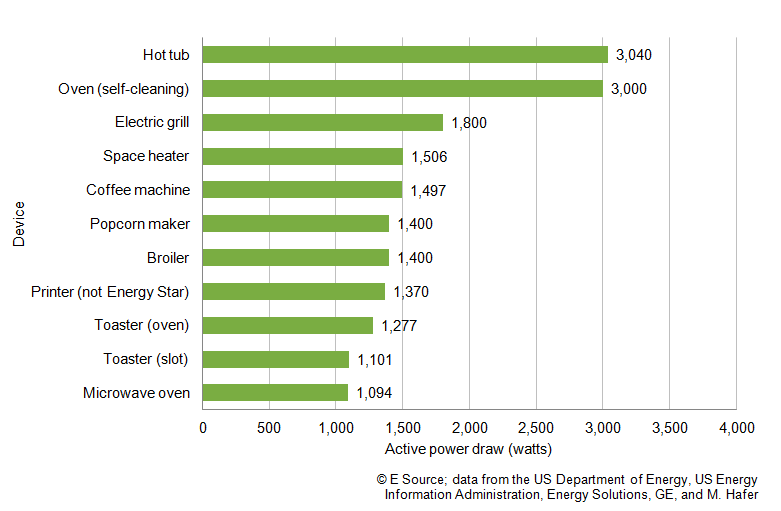
Several devices also have large active modes, with some drawing thousands of watts. For example, hot tubs and ovens have active power draws of 3,000 W (Figure 1). We found that the most demanding products (by active power mode) universally feature some sort of heating element, which is consistent with findings from previous studies.
Figure 1: Largest active power draws by device
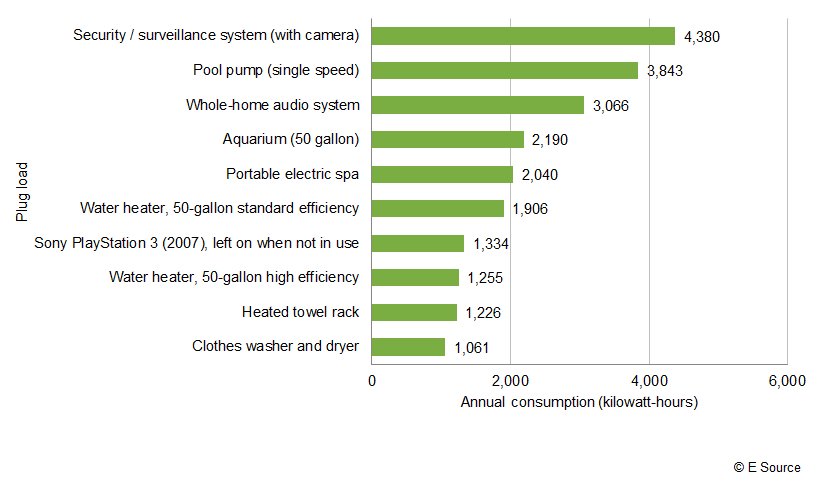
Annual energy consumption depends on not only how much power a device draws in active, idle, and off modes, but also how long the device was used in each mode. As one might expect, we found that devices that are in active or idle mode for most of the day tend to consume the most energy annually. For example, a self-cleaning oven has a large active power draw (3,000 W), but isn’t frequently used, and thus produces a moderate annual energy consumption of 355 kilowatt-hours (kWh). Similarly, a hot tub has a large active power draw (3,040 W) and a comparatively moderate idle power draw (225 W). However, the hot tub spends the entire day either in active mode (with jets and lights on) or in idle mode (circulating the water), which results in a large annual energy consumption of 2,040 kWh (Figure 2).
Figure 2: Top 10 residential plug loads by annual energy consumption
Not surprisingly, devices that were always on, or always in active mode, also tended to be large annual energy consumers. For example, the Natural Resources Defense Council (NRDC) found that a heated towel rack, which runs 24 hours a day to keep towels toasty, consumes 1,226 kWh a year—about $147 annually for the average American. Similarly, the whole-home security system included in our data was always in active mode, and thus used thousands of kWh annually, making it one of the biggest—and most expensive—residential plug loads we measured.
Electric Vehicles in Perspective
To compare the annual energy usage of an EV to that of residential plug loads, we collected data on some common EVs, assuming that the average car travels 11,926 miles in a year. We split the data we collected into two types of EVs: plug-in hybrids and fully electric vehicles. Plug-in hybrids, like the Chevrolet Volt, have both a gasoline and an electric motor and can be recharged from an outlet, allowing them to drive longer distances using only the electric motor. Conversely, the fully electric vehicles, such as the Tesla Model S 85, are only equipped with a battery pack and an electric motor to run the vehicle.
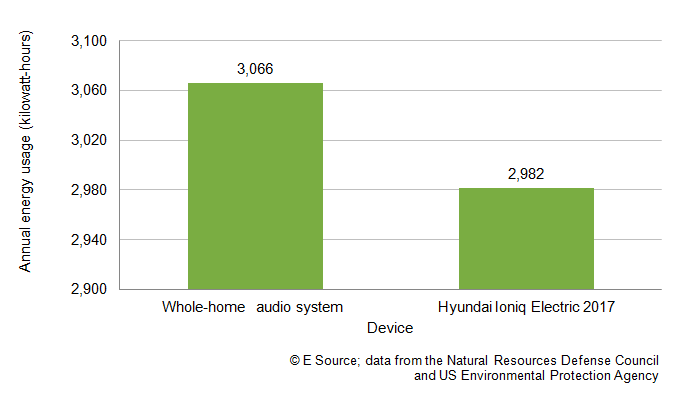
The annual electricity consumption of an EV depends largely on the battery size and type of EV. In general, batteries are more efficient than they were two decades ago; however, EVs today typically have larger-capacity battery packs and longer ranges among both plug-in hybrids and fully electric vehicles. To understand where hybrid cars fit in terms of common plug loads, we modeled that a fully electric 2016 Tesla S85 would use about 4,531.88 kWh to travel 11,926 miles. While this is a large annual energy usage, it’s equivalent to a larger-than-average whole-home security/surveillance system, including cameras. Thus, despite EVs’ large power draw, other residential devices join electric cars in the top when comparing annual energy consumption. For example, driving a fully electric 2017 Hyundai Ioniq for a year (11,926 miles) can use slightly less energy than using a large whole-home audio system (Figure 3).
Figure 3: Annual energy usage of an EV and home audio system
Commercial Dishwashers: Washing Away Energy Efficiency
Commercial plug loads can easily dwarf even the largest residential end uses. Commercial kitchens and laboratories both use hundreds of thousands of kWh annually, with frequent use of high-power devices. Refrigerators and freezers are common power-hungry appliances. While they may have smaller active power draws, these appliances need to run constantly to keep items cool—and this long active time adds up. Furthermore, commercial kitchens run industrial dishwashers that require hot water and high pressure for a large portion of the day, which also leads to massive annual consumptions. According to the Energy Star Commercial Kitchen Equipment Savings Calculator, a standard commercial dishwasher uses up to 72,473 kWh in a given year, which is vastly more energy than any single residential plug load. Specifically, this commercial dishwasher used 17 times as much energy as the largest residential plug load we measured.
The good news is that Energy Star–certified products are notably more efficient than their standard counterparts across the board. Our research found that these products are typically 10% to 50% more efficient than standard devices and appliances. In the example of the commercial dishwasher, the Energy Star counterpart used only 45,561 kWh in a year—a 30,000 kWh difference, which could save $3,300 on average in annual electric costs. Thus, while commercial dishwashers have the potential to be huge energy hogs, choosing energy-efficient models can make a substantial difference.
Smarter Homes
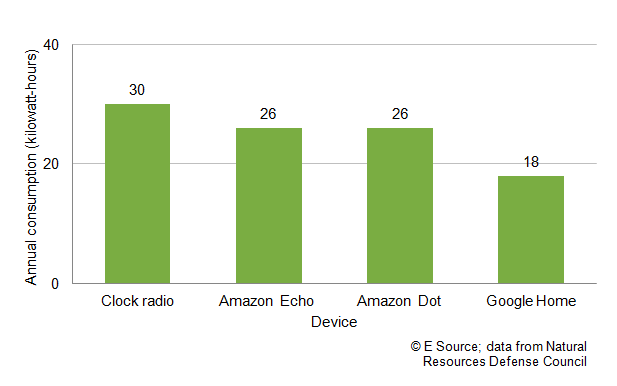
Smart home technologies have been edging their way into the market over the past few years. Some new voice-control devices, such as Amazon Echo and Google Home, consume little power, using just a few watts even in active mode. For reference, a microwave oven pulls 4.3 W, even when completely off. Furthermore, all the voice-control devices we measured use less energy annually than a typical clock radio (Figure 4).
Figure 4: Annual energy consumption of voice-control devices compared to a clock radio
Similarly, streaming boxes, such as Apple TVs, have become more popular in the past few years and in some cases are beginning to replace cable set-top boxes. Streaming devices are dramatically more efficient than cable set-top boxes, consuming about one-tenth as much energy annually. Streaming boxes are far more efficient for watching TV than video game consoles, which typically require both the set-top box and the console for streaming. For example, a 2015 NRDC study found that streaming content using an Apple TV drew only 2 W, as compared to using an Xbox One, which drew 72 W.
Streaming devices are dramatically more efficient than cable set-top boxes, consuming about one-tenth as much energy annually.
However, not all new residential technologies were more efficient; technologies like laptops, TVs, home audio systems, and video game consoles all increased the amount of power they drew over the past few years. For example, the active power draw of Microsoft’s Xbox console was 64 W in 2001, but this number grew to 115 W when Microsoft launched its new Xbox One console in 2013. Another example is the Nintendo Wii, where the active power draw of the console doubled between the original version launched in 2006 and the newer Wii U in 2012.
What’s Next?
As devices and appliances trend toward being bigger and brighter, there will almost certainly be a corresponding increase in plug loads. However, new, efficient technologies have the potential to replace older ones; for example, choosing tunable, connected LEDs over incandescent bulbs or a virtual DVR instead of a physical DVR. Thus, the advent and implementation of new and efficient technologies could help to balance out the increase from other plug loads. As an example, video game consoles tended to use large amounts of power, regardless of manufacturer, throughout the years. As video game consoles and other computers have become more powerful over the past decade, their power draws have also tended to increase. It’s worth noting, however, that these devices are more efficient than they were a decade ago—their demand for power simply grew faster than their efficiency. If this trend continues, then efficiency in computers and related devices will most likely be a key area of development in the coming years.
Furthermore, there may be a point in the future when individual plug loads operate at a high efficiency, as streaming boxes do. In this situation, the solution to reducing a building’s consumption may lie in smart home technologies. Smart home technologies might be able to increase the overall efficiency of a building by coordinating between devices to make more-efficient decisions. An example would be a smart thermostat, which might choose to run a low-power device, like a fan, whenever possible and only run the high-power devices, like air conditioning, when the low-power device alone is not sufficient.
However, until we reach that point, we recommend turning off and unplugging devices when not in use, choosing Energy Star–certified products where available, using streaming boxes such as Apple TV, and being mindful of always-on devices to cut future energy usage.
Resources
Plugging the plug load data hole E Source (2012)
OK Google, How Much Energy Does Alexa Consume? E Source (2017)
National Energy Use of Pay-TV Set-Top Boxes Is Heading Down, NRDC (2016)
Home Idle Load: Devices Wasting Huge Amounts of Energy When Not in Use, NRDC (2015)
US Residential Miscellaneous Electric Loads Electricity Consumption, American Council for an Energy-Efficient Economy (2008)
Electricity Use in the Commercial Kitchen, Oxford International Journal of Low-Carbon Technologies (2016)


