This year, if they weren’t already, wildfires became a household name across the US. In June, the Northeast had a taste of the experience with smoke migrating southward from Canadian wildfires. On one particularly smoky Tuesday evening, New York City had the worst air quality in the world. More recently, in September, smoke settled yet further south, leaving its mark via hazy skies and poor air quality in Alabama, Georgia, and Florida.
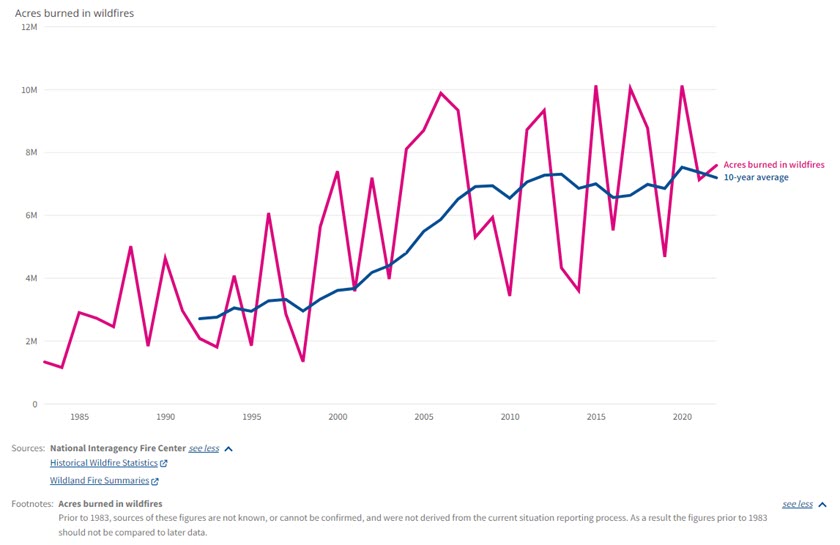
When did wildfires start getting so bad that they wrapped entire swaths of the US in smoke and smog? The numbers share a startling story: from 2000 to 2020, the 10-year average for US acreage burned increased 100%, burning the equivalent of 5.6 million football fields in 2020 alone (figure 1). The US Forest Service calls it a crisis, and resiliency plans echo from conversations in the halls of state legislatures up to Congress and the White House.
Figure 1: Wildfire trends
So, what’s changed? And for utilities preparing for this change, is there a simple first step they can take to mitigate the risks of wildfire? For this article, I sat down with two E Source insiders, Tom Martin, vice president of commercialization for Data Science, and Ross Conner, director of Data Science, to answer these questions. In our discussion, I received a surprising explanation, informally known as the Swiss Cheese Model of wildfire risk mitigation. There is a layered approach and an easy first step to getting started in assessing risk within your utility’s model. If you’re familiar with the problem, feel free to skip over the next couple of sections and head right down to the Swiss Cheese Model.
Migration and relocation can become risky business
When we started our conversation, Tom and Ross were both quick to call out the challenge people are playing in this equation. And, from Tom’s point of view, it’s something utilities have limited control over:
People are moving into more and more wooded areas, more outside of the city and outside of the suburbs into areas where lines have to run through heavily vegetated areas that create more risk per person.
Recent publications back Tom’s statement. A 10-year study by the University of Vermont, highlighted in the article Americans Are Flocking to Wildfire: U.S. Migration Study, claims that more people are moving into zones of wildfire danger
. Simply put, the study states that people are moving into harm’s way, into regions with wildfires and rising temperatures, which are expected to become more extreme. Utilities must serve, and this movement increases utility infrastructure exposure to higher risk.
Both Tom and Ross share intimate backgrounds with wildfire analysis. Tom stood up PG&E’s initial wildfire investigation team after the Napa wildfires of 2017. While Tom’s experience is focused operationally (organizing teams and forensically relying on data to determine what happened), Ross’s background is focused on the data that helps us understand the risk. His first job out of college was working for the Canadian Forest Service in collaboration with the University of Alberta to develop models for fire risk.
While we can’t control the movement of people, utilities can take a data-driven approach to understand and account for the new risk profile of areas these customers are moving into. This creates an opportunity to ‘buy down’ this risk with spending on mitigation. We refer to this as risk-spend efficiency. Tom describes it best:
Not only are we identifying where there is risk but also what we can do about that risk. How do I make sure that every dollar I spend goes toward the thing that’s going to be the best in terms of buying down risk and minimizing the negative impacts of things, like wildfire, that happen on my system?
Old policy and new policy pose a unique challenge
The migration challenge aside, old and new policies alike are affecting the wildfire risk profile for utilities. The case of older policy is well documented and neatly summarized by the endearing memory of Smokey Bear’s now infamous line: “Remember—only you can prevent forest fires.”
For nearly a century, North American wildfire prevention has prioritized a zero-tolerance threshold for wildfires. While this has changed in recent years to support controlled burns, much of the damage is already done or waiting to happen. Ross likens the issue to a powder keg:
Because we’ve been suppressing fires with increasing success over the last 80 years, we now have a lot of mature stands, a lot of forests that are dry with a lot of fuel accumulated underneath them, and they’re just waiting for their chance to burn up because that’s what the cycle is like and we have massive amounts of contiguous fuel ready to burn.
In nature, some species require fire. Like the Jack pine, whose seeds require exposure to fire to sprout. Many forests are designed to eventually burn in time, but policy has suppressed the natural flow of fires and allowed for decades of fuel to build up to dangerous levels, culminating in many of the wildfires we see today.
The other policy challenge is a more recent phenomenon—an interpretation of a decades-old regulation known as inverse condemnation. In some states (like California), it’s being used to hold utilities financially liable for accidentally starting a fire that then creates a loss of property. One particularly startling scenario that Tom shared: a drunk driver running into a pole that falls to the ground, the wire sparking and causing a fire. Inverse condemnation would say the utility is liable.
While this has existed before as a California-specific issue, lawsuits in other states are potentially exposing utilities to an inverse-condemnation risk, even if the rule isn’t officially on the books in their service areas.
Nationwide, utilities cause roughly 10% of all wildfires, but this issue exposes utilities to more reliability risk. Utilities are a ripe target—a large institution with (depending on the severity) enough resources to handle the litigation risk if blamed for the fire. In this case, data-driven decision-making can help, not only to mitigate the risk up front but also as a means of justification.
Tom summarized this issue nicely around hindsight bias:
There’s a lot of hindsight bias that seems to be going into these conversations to answer the question were you operating the grid as safely as possible? We didn’t expect a wildfire to happen, so because one did happen, that must have meant you’re doing something that wasn’t perfect. But flowing electricity to millions of customers carries risk. We’re never going to be able to buy all risk down. Risk will continue to exist on the system, so data-driven support systems need to focus on how we make sure that the investments we’re making are buying down as much risk as possible and providing a defensible framework to support those investment decisions.
Too little rain is teeing up the perfect storm
The final piece of what has changed? Weather trends over time. A notable example of this scenario is the more recent Maui wildfires. Leading up to the Maui fires this year, the island experienced a two-category increase in drought severity, meeting the definition of a flash drought. Precipitation is a key ingredient for wildfires because it’s a direct link to the moisture content of fuels. And our climate is getting both drier and warmer. The result is a longer and more active fire season and fire seasons in unexpected places.
The key challenge this presents is a lower threshold for ignition due to lower moisture content in fuel. The trend is worrying. When pressed on the topic, Tom shared, “This is no longer a Southern California or even a West Coast issue, this is a continental challenge being discussed in utility board rooms across the country.”
The Swiss Cheese Model
I first heard of the Swiss Cheese Model for wildfire while chatting with some PG&E folks at T&D World (shoutout to the PG&E emergency power shut-off team for coming up with food pun naming conventions!). The name comes from the causal chain of events required for a utility-based wildfire to occur:
- Probability of a spark event. This is the first layer of the Swiss Cheese Model. What’s the probability of a piece of equipment causing a spark? No spark, no fire.
- Probability of ignition risk. This is the second two-part layer. Can the spark land on fuel? And, if it does, will that fuel combust and ignite?
- Probability of spread risk. If fuel ignites, what’s the probability that the fire spreads from that fuel to other fuel sources?
These are the layers of cheese, or the chain of events that must occur for a wildfire to happen. The hole in the cheese is the probability of answering “yes” at any one step. Ideally, with a utility’s model, things are successfully layered where at any one point in the chain of events, the probability of the event taking place is zero (or close enough to zero)
Put another way, Ross shared the chain of events using the following examples:
If none of your equipment ever sparks, you have no fires. On the other side, if all your equipment sparks—but it all hits fireproof shielding—you’re not going to have any fires either. Likewise, if there is no fuel to burn (even if you do have a fire), it’s not going to spread. It’s a multievent factor that leads to a problematic fire, and so you have opportunities to limit each of these events from occurring.
In construction, and in some areas of our industry we’ve coined the term near misses. For example, when a hammer falls from an elevated site and hits someone, a few things had to happen in the causal chain for that to take place. In the case of wildfire mitigation, you need to record these near misses to understand the risk. And if you can mitigate at any one step along the causal chain, you’ve improved your chances of preventing a severe negative event.
Mitigate risk with the help of data science
Our work on wildfire covers the spectrum of potential risks and has historically started with the first step in the chain: spark risk driven by equipment failure. This is something E Source Data Science (along with the industry) has become particularly good at predicting and tracking.
But is there a surefire layer in the causal chain that, if addressed, can reduce risk? Ross emphasized that you want to model every part of the causal chain to estimate and understand risk, but if you were to pick one primary ingredient, it would be the presence of fuel and the moisture content of that fuel within a few meters of your infrastructure. Many models consider hundreds of variables, but by considering these two factors over time, utilities can create a starting point heat map (pun very much intended) of wildfire risk across their system.
While I wish there was a silver bullet for wildfire mitigation, there isn’t. But there is at least a first step to get you started. Contact us today if you’d like to connect with Data Science about wildfire analytics.