Virtual power plants (VPPs) are making a comeback and taking center stage. And big names like Jigar Shah’s Loan Programs Office (LPO) of the US Department of Energy (DOE) are throwing their financial muscle behind the next big wave of investments. According to the Canary Media article Sunnova seeks $3.3B DOE loan guarantee to expand virtual power plants, “Shah has described how LPO could offer low-interest loans or loan guarantees to companies that provide these technologies. In exchange, LPO would require those companies to reduce the cost of buying or financing for customers who might otherwise struggle to afford them.”
What are VPPs anyway? VPP describes a bundle—also known as an aggregation—of distributed energy resources (DERs) that can deliver grid capacity and energy at a lower price point than traditional generation portfolios and grid buildouts. DER technology ranges from solar panels with smart inverters and batteries to EVs and smart home devices.
The idea of a VPP sounds simple: pool together many smaller, behind-the-meter DERs and spread out their ability over a utility’s service area to fill energy gaps and supply power during grid peaks. But, unfortunately, it’s not that easy. It takes complex software to deploy, group together, and coordinate these technologies.
While a lot of VPP innovation dollars are going toward software solutions, we think success lies with developing a solid understanding of the utility customers who will host these DERs. Which customers are most likely to adopt DERs? And after they adopt, how will they want to use them? Aside from offering emergency power backup, how can utilities approach customers with other value propositions in exchange for controlling or manipulating customers’ DER performance?
Meet the E Source DER Insights Center
To answer these questions and more, we continue to invest in the US DER Insights Center and Canadian DER Insights Center. Both tools are available to members of the E Source Distributed Energy Resource Strategy Service to help them better understand customers’ perceptions of and behaviors around DER technologies.
Who are your residential customers? How do they feel about DERs, emerging technologies, smart meters, products and services, and their utility’s brand image? The DER Insights Center allows us to provide detailed data and analysis across regions or census divisions, demographics, household characteristics, energy profiles, and utility program participation to help you not only better understand your customers but also to better serve and support them.
The DER Insights Center can help you improve program design and customer interactions by giving you a deeper understanding of customers’ needs, behaviors, and beliefs. With data collected by E Source Market Research, we can help you:
- Analyze primary market research to create effective programs and services
- Compare internal metrics across the utility sector to evolve your customer strategies
- Improve satisfaction by designing customer-centric initiatives that better meet customers’ needs
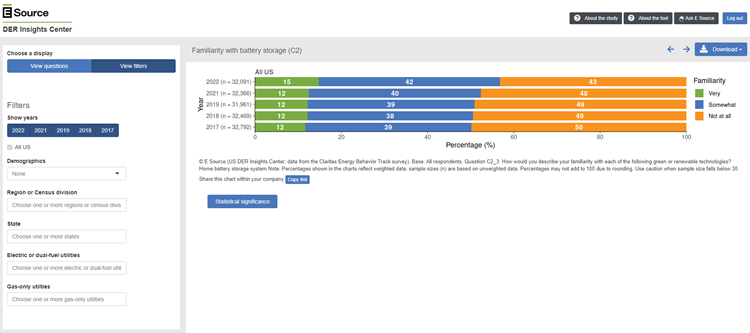
The DER Insights Center offers a customizable view into our vast collection of data. With a wide breadth of questions or filters to pick from, you have detailed customer information at your fingertips (figure 1).
Figure 1: A closer look at the DER Insights Center
Library of survey questions
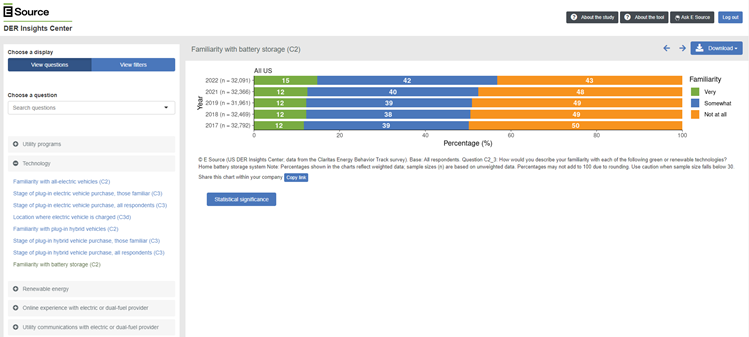
Filters to narrow your search
We’ll update the DER Insights Center with 2023 data later this year.
How do utility customers really feel about renewable energy?
Most recently we updated the DER Insights Center with data on customer perceptions related to distributed renewable energy and EVs.
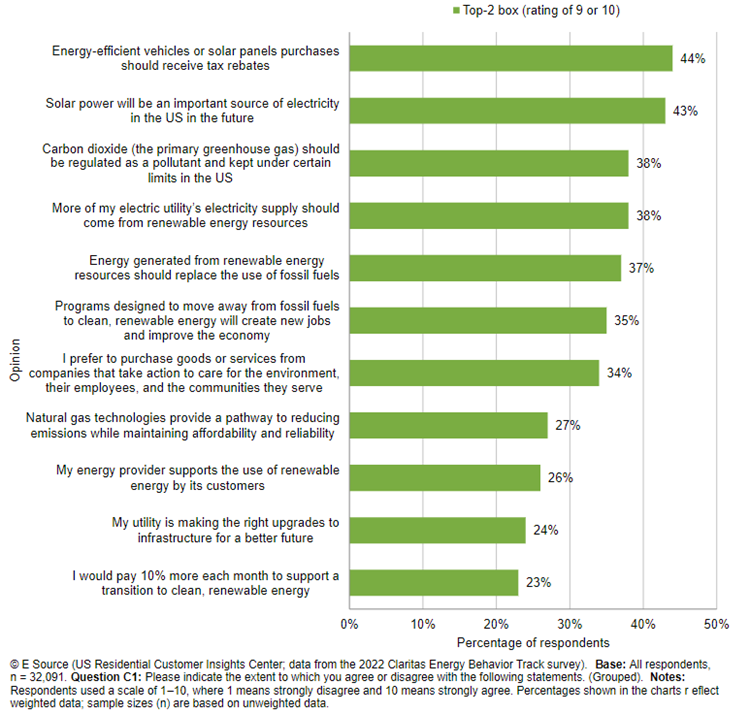
Respondents showed the greatest support for tax rebates for solar or energy-efficient vehicles (44%). And they told us they see solar as an important energy source (43%) (figure 2). Some respondents also support:
- Regulating carbon dioxide (38%)
- Increasing the supply of renewables (38%)
- Replacing fossil fuels with renewables (37%)
Figure 2: Consumer support for renewable energy