Transportation electrification (TE) is among the most exciting and revolutionary transformations we’ve ever seen in the utility industry. It’s also one of the quickest to evolve and often feels difficult to keep up with. Utilities are preparing to roll out new TE programs and update their infrastructure to handle new loads, while solution providers and manufacturers are working to capture new business across multiple TE revenue streams.
Until now, it’s been complicated and time-consuming to find detailed data about what utilities are spending on TE and where they’re focusing their program efforts. To help you and your sales team find and capture new business and understand utility TE programs, spending, and rates, we created E Source TE Insights as part of our new Mobility portfolio. The tool organizes data from utility TE plans, EV-specific rates, and customer rebates into one easy-to-navigate platform for a wide range of users.
We’ve designed the tool specifically to offer insights relevant to various roles across your business development, product development, strategy, and leadership teams.
Business development
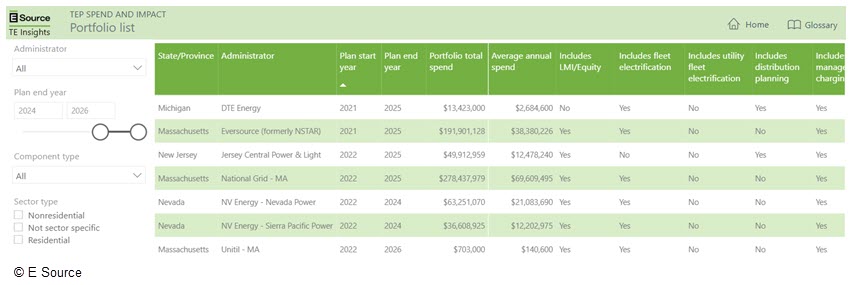
TE Insights helps you identify trends in utility investment and find filings for future programs and spending. Filter documents or portfolios by year to identify plans for future investment (figure 1). Or use visuals to quickly see where utilities are prioritizing spending. With slicers, you can narrow down to the specific utilities, regions, and sectors that are most relevant to your business. The “Document library” keyword search also helps you find mentions of specific technologies to find utilities looking for your solutions.
Figure 1: “Portfolio list” dashboard, filtered by years
Market sizing
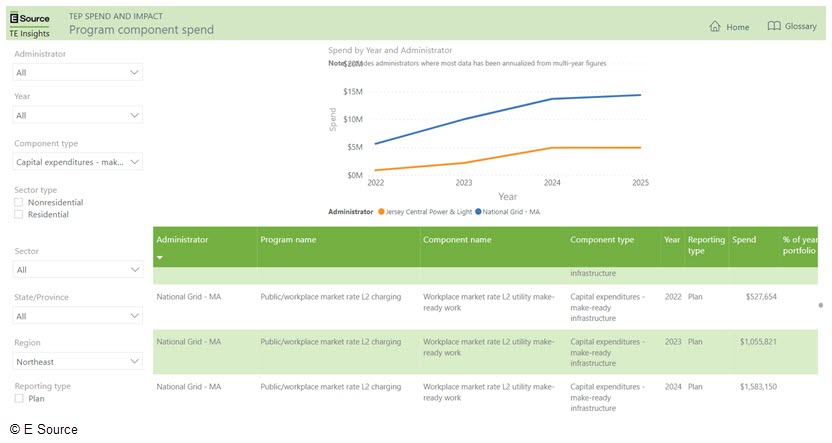
TE Insights is the only tool in the industry that can provide you with market sizing data on utility TE investment. Quickly estimate utility investment in DC fast-charging equipment or multiunit dwelling Level 2 charging infrastructure in TE plans. This data will help you make effective product strategy decisions and form the foundation of your utility TE sales pipeline. Are you focused specifically on Northeast sales of Level 2 charging equipment for public or workplace settings? Data sets like the one shown in figure 2 show you exactly how much Northeastern utilities with TE plans are spending in this category, individually and collectively.
Figure 2: “Program component spend” dashboard, filtered by region
Product development and strategy
As you’re developing and growing your portfolio of TE offerings, TE Insights can help you fully understand utility portfolios and spending.
Data visuals, slicers, and exported results help you explore utility spending
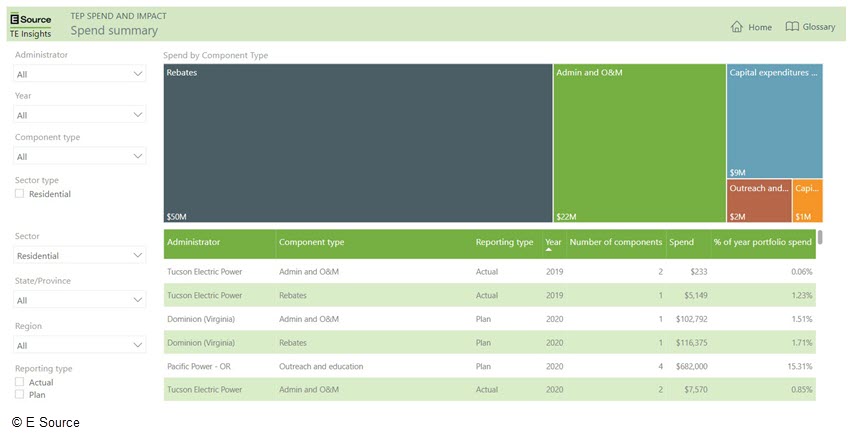
With dynamic visuals, you can quickly see how utilities are allocating TE budgets between rebates, capital investments, outreach and education, and more (figure 3). Slicers make it easy to focus on budgets and goals for certain utilities, regions, sectors, impact types, and more. Also, each data point has links to the right page in the reference document so you can see more context about each value.
Figure 3: “Spend summary, filtered by residential
The “Document library” supports product development
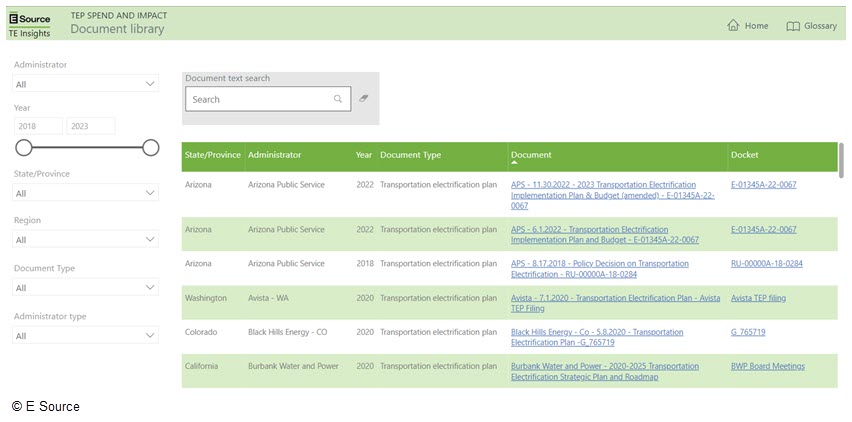
The “Document library” compiles TE plans, major TE filings, reports, and evaluations so you can easily find examples of how utilities are building the case for their TE investments and responding to regulators (figure 4). You can also do a keyword search across all documents stored in TE Insights to find mentions of specific technologies or utility concerns.
Figure 4: “Document library”
EV program and rate design
Perhaps you’re focused on offering products for and finding new business at utilities that don’t have full-fledged and filed TE plans but offer EV rates or EV programs. TE Insights makes it easy to compare and navigate current utility offerings.
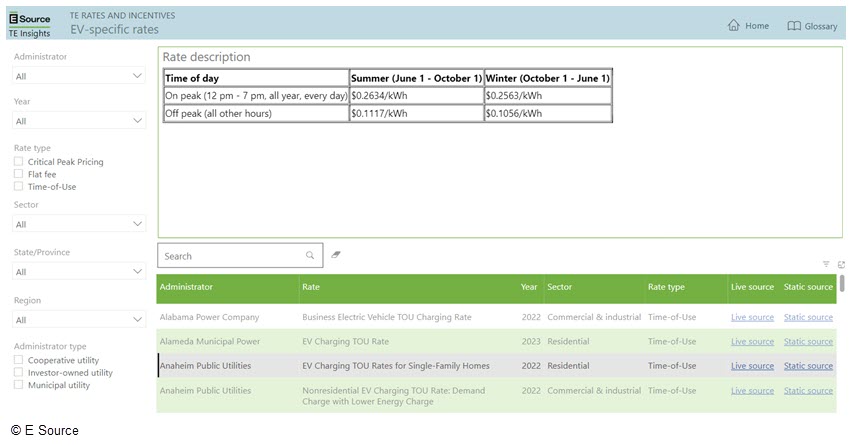
Selecting a rate or program from the lists on the “EV-specific rates“ and “EV incentive programs” dashboards pulls up a program description, and it’s easy to navigate to the next item on your list. You can also search the program table for keywords (figure 5).
Figure 5: “EV-specific rates” dashboard
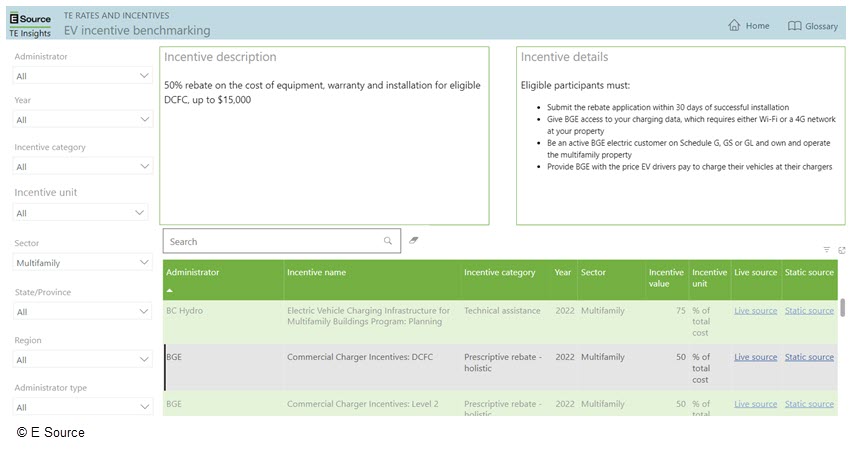
The “EV incentive benchmarking” dashboard includes specific incentive amounts from EV programs, keeping you equipped with the data you need for utility program implementation business development (figure 6). Incentives range from e-bike rebates to funding for DC fast-charging installation.
Figure 6: “EV incentive benchmarking” dashboard
TE Insights is an exciting new data tool that revolutionizes the way solution providers and OEMs access critical data to grow their business in the TE space. By providing comprehensive spending data on utility TE portfolios, essential insights on EV rate and program design, and a scope of market size, TE Insights is an invaluable asset for businesses. With TE Insights, solution providers can:
- Make informed decisions
- Customize product offerings
- Tap into the immense and exciting potential of this dynamic market
The data offered by TE Insights provides insights into the scope and scale of utility opportunities in the TE landscape, enabling solution providers and OEMs to strategically position themselves and their products for success. Equipped with this knowledge, companies can confidently expand their operations, forge strong partnerships, and drive meaningful growth in the dynamic world of transportation electrification.