Utility websites play an important role in helping customers find information and complete tasks online. But how readable is this content? We assessed the readability of utility website features as part of the E Source 2025 Website Benchmark study and found that utilities can still improve the readability of their websites overall.
Over the past several years, utility website readability has stayed consistent, averaging around a seventh grade reading level. In 2025, we added Financial Assistance pages to the assessment. These pages were less readable than other features, which raised the overall average reading grade level for utility websites.
Why is readable content important?
Readable website content helps customers quickly find the information they need and complete tasks. It’s also more accessible and inclusive for customers of different abilities and education level.
Improving the readability of your website content will reduce customer effort—the amount of effort it takes a customer to complete a task—and improve customer experience. This can translate to improved self-service success rates and fewer calls to the contact center.
For the study, we evaluated public web pages and considered a reading grade level of 8.0 or lower acceptable. But we still recommend aiming for a 5.0 reading grade level to accommodate all readers.
For more information on the benefits of readable content, see the E Source report Write more-readable content to make it easier for customers to self-serve (available to members of the E Source Digital Self-Service).
How readable are utility website features?
We measure readability using the Flesch-Kincaid grade-level scale. This scale aligns with US academic grade levels. The lower the grade level, the more people can understand the text.
In 2025, we found that the public feature with the lowest average reading grade level was Payment and Billing options (grade level 6.7). The public feature with the highest average reading grade level was Financial Assistance (grade level 8.6).
While all but two features had an average score below an eighth grade reading level, no feature scored near a fifth grade level average.
Average readability scores for public features 2025


We’ve measured the readability of utility websites every other year since 2019. The overall readability of utility websites has remained around a seventh to eighth grade level.
Average readability scores for public features 2019–2025

How can you improve the readability of your website?
Start by prioritizing features that customers use the most or are more critical for customer experience, like Financial Assistance pages.
To write readable content, make sure you’re using plain language. The plainlanguage.gov Design for reading guide is a good place to start. You can also use tools to help improve readability, but be sure to review content for accuracy and effectiveness.
It’s also important to measure your content’s readability and test its success with customers. We recommend measuring your content’s reading level by running the Flesch-Kincaid grade level test on your content.
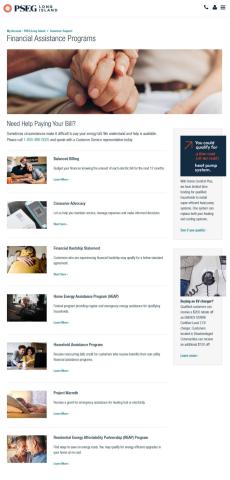
Consider looking at what other utilities are doing to make their content more readable. For example, PSEG Long Island had the lowest average readability score (grade level 3.6) among all utilities in the Website Benchmark. The utility uses plain language, short sentences, and white space to make it easy for customers to find and understand information.
PSEG Long Island’s Financial Assistance page is a good example of an important feature that should be readable for all customers.
PSEG Long Island Financial Assistance web page