DSM Budget Trends Through 2020

By Liza Minor
June 14, 2019

DSM Budget Trends Through 2020

As state and federal energy-efficiency policies are changing and measure baselines are rising, utilities are shifting their demand-side management (DSM) budgets to find more cost-effective savings opportunities. To understand how DSM budgets are changing, we analyzed planned utility budgets from 2016 to 2020, using E Source DSM Insights, and we found:

  • Utilities are allocating more of their budget to administrative spending
  • Customer incentives still make up the biggest portion of the budget
  • Utilities are shifting budgets from residential to nonresidential programs

How much do utilities spend on evaluation?

We presented a poster at the 2019 International Energy Program Evaluation Conference that provides a deeper analysis of the evaluation spending trends covered in this report. Our analysis provides an understanding of the share of spending that evaluation accounts for within administrators’ DSM portfolios. We also show the variability of evaluation spending by region, administrator, portfolio size, and program category.

Downloadesource-iepec-poster-2019.pdf

These trends are consistent with what we’ve been hearing from utilities as they address cost-effectiveness challenges due to rising baselines, most notably changes from the Energy Independence and Security Act of 2007 (EISA)—for more information, see our blog post Preparing Your DSM Portfolio for EISA Uncertainty. Residential lighting measures are most affected by EISA, and many utilities are shifting their focus toward commercial savings opportunities to make up for the lost residential savings. As a result, utilities are testing new, more-expensive program models that come with higher administrative costs, such as pay-for-performance programs—which track energy savings using real-time monitoring data.

At the Spring 2019 E Source DSM Executive Council in Boston, a few attendees shared that contractor payments have moved into administrative spending, which has increased administrative costs. Overall, the DSM budgeting process is inconsistent across organizations, which makes it challenging to provide a comparison.

Utilities are allocating more of their budget to administrative spending

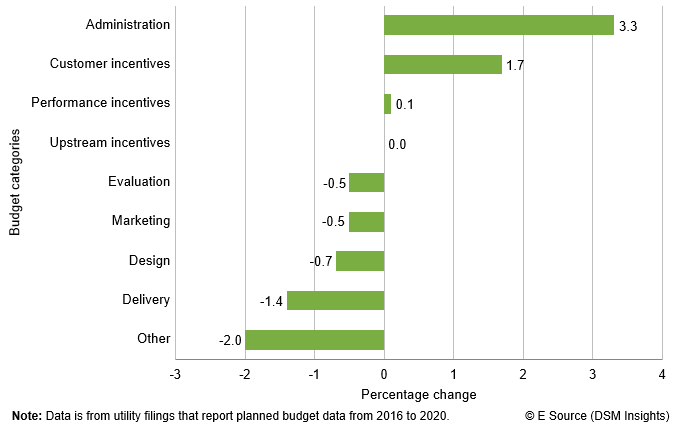
Looking at all available budgets from 2016 to 2020 in DSM Insights, we found that utilities are increasing the percentage of budget allocated to administration and customer incentives by 3.3% and 1.7%, respectively (figure 1). They’re also decreasing the percentage of total budget spent on delivery.

Figure 1: Utilities shift funding into the administrative budget category

Utilities are spending more on administration and customer incentives and decreasing spending on delivery through 2020.
Bar chart showing E Source DSM Insights data on budget allocation change from 2016 to 2020. Administration grew 3.3%, Customer incentives grew 1.7%, Performance incentives grew 0.1%, Upstream incentives stayed the same, Evaluation decreased 0.5%, Marketing decreased 0.5%, Design decreased 0.7%, Delivery decreased 1.4%, and Other decreased 2.0%.

Budget category definitions

To compare budget categories across administrators in DSM Insights, we created a standardized methodology for categorizing budget types in utility DSM filings and reports. For example, if the program administrator breaks out incentives but no other detailed budget item, we will consider the remainder of the program spend as a delivery cost. In some cases, program administrators break out admin and incentives. In those instances, we will bucket the spending into those two categories. We define the budget categories as follows:

  • Admin. These are the costs associated with planning and implementing a program. Typically, admin costs pay for salaries and training of program administrator staff. Unless costs are accounted for elsewhere, administrative costs can include marketing, evaluation, and design.
  • Customer incentives. These include rebates paid to customers and retailers.
  • Delivery. Delivery costs are used for the implementation of the program. Generally, these pay for technical assistance, installation, and other energy services. If costs aren’t accounted for elsewhere, delivery may include marketing, evaluation, and design.
  • Design. These are the costs to set up program process and scope.
  • Evaluation. These costs pay for studies and reports that validate program impacts and processes.
  • Marketing. Marketing costs are used to acquire and educate program participants. The data within the marketing budget category encompasses whatever the utility reported as marketing, advertising, or education.
  • Total. This is total cost of implementing a program—sum of all categories.
  • Upstream incentives. These are rebates paid to manufacturers.
  • Utility performance incentives. Regulators can use these funds to incentivize program administrators to reach DSM goals and invest in programs.
  • Other. These costs are otherwise not characterized in the categories above.

Customer incentives still make up the biggest portion of the budget

In 2020, the average planned DSM budget is primarily composed of incentives, administration, and delivery (figure 2).

Figure 2: The utility budget of 2020

Customer incentives make up over half of utility budgets in 2020, followed by administration and delivery.
Budget categoryPercentage of budget
Note: Percentages may not equal 100 due to rounding. © E Source (DSM Insights)
Customer incentives60.8
Admin24.4
Delivery12.0
Evaluation1.0
Marketing0.9
Design0.2
Utility performance incentives0.2
Other0.4

Utilities are shifting budgets from residential to nonresidential programs

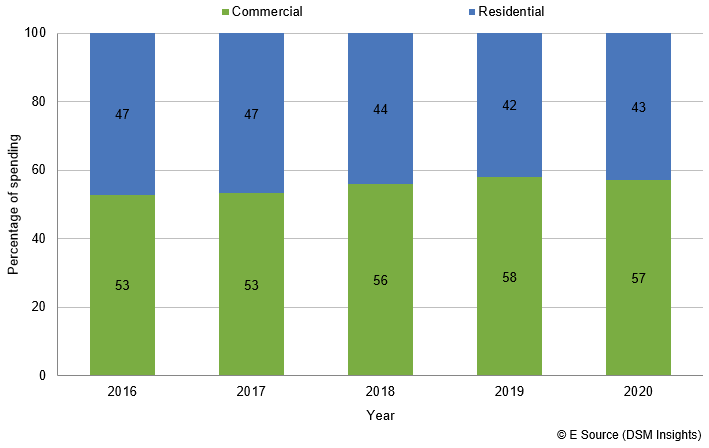
For electric efficiency programs, we identified a 4% swing from residential to commercial sector spending for utilities with planned data for 2016 to 2020 (figure 3). Planned commercial sector spending will increase from 53% to 57% of DSM budgets, while residential sector spending will decrease from 47% to 43%.

Figure 3: Utilities are spending more on nonresidential electric efficiency programs

Utilities are shifting electric spending dollars into nonresidential programs through 2020.
Bar chart showing commercial and residential budget allocation from 2016 to 2020. In 2016, 53% commercial and 47% residential. In 2017, 53% commercial and 47% residential. In 2018, 56% commercial and 44% residential. In 2019 58% commercial and 42% residential. In 2020, 57% commercial and 43% residential.

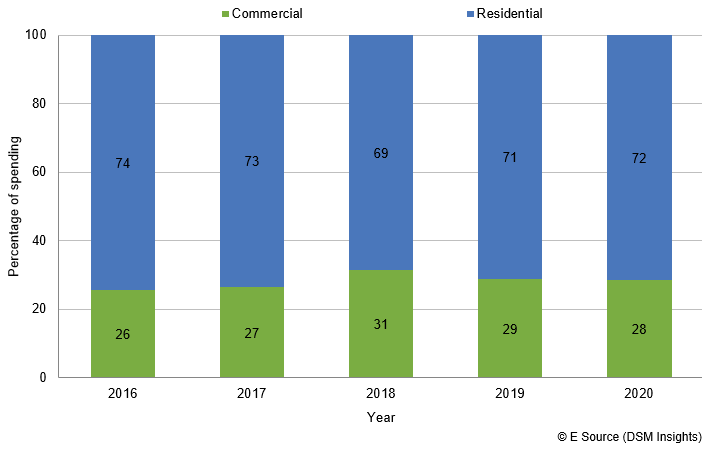
For gas efficiency programs, we identified a 2% swing from residential to commercial sector spending for utilities with planned data for 2016 to 2020 (figure 4). Planned commercial sector spending will increase from 26% to 28% of DSM budgets, while residential sector spending will decrease from 74% to 72%.

Figure 4: Utilities are spending more on nonresidential gas efficiency programs

Utilities are shifting natural gas spending dollars into nonresidential programs through 2020.
Bar chart showing commercial and residential percentage of spending from 2016 to 2020. In 2016, 26% commercial and 74% residential. In 2017, 27% commercial and 73% residential. In 2018, 31% commercial and 69% residential. In 2019 29% commercial and 71% residential. In 2020, 28% commercial and 72% residential.

© 2008 - 2025 E Source Companies LLC. All rights reserved.
Distribution outside subscribing organizations limited by license.

Source URL:https://www.esource.com/429191abpd/dsm-budget-trends-through-2020